Everything here is an experiment, built in my spare time: at weekends, or as a warm-up before the working day starts. Some I built just to try out a new technology. There are 56 of them, each a small app written from scratch.
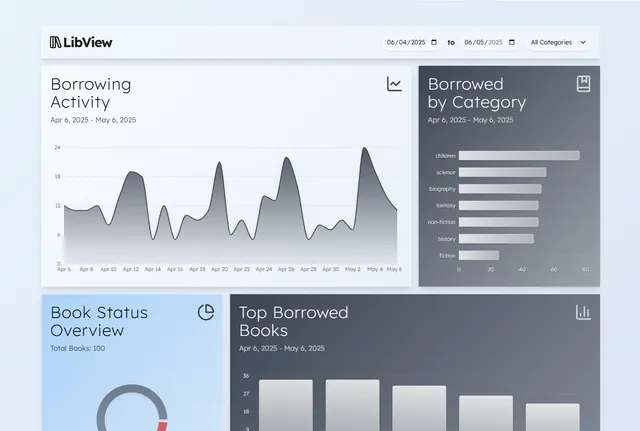
A library dashboard for tracking borrowing activity: filter by date and genre, compare periods and spot reading trends in clean, interactive charts.
A dashboard for a library's borrowing data: activity over time, borrowing by category, a status donut that switches the list below it between available, borrowed and overdue books, the five most borrowed titles, and a month-against-month comparison with daily averages and percentage change. Date-range and category filters in the header feed most of the panels through a shared React context, and every chart is Recharts. The data is generated when the page loads, a hundred books and six months of borrowing that runs busier at weekends, so the numbers are different on every visit.
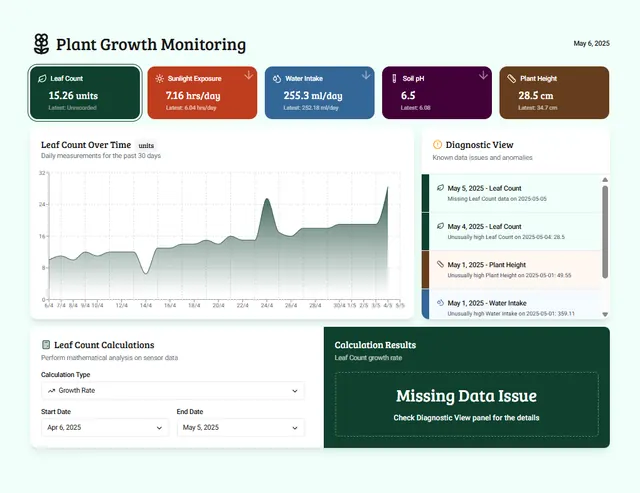
A smart plant growth dashboard: monitor sunlight, water, soil pH and height in one place, with diagnostics that flag unusual data patterns early.
A dashboard for a plant's last 30 days: five cards for leaf count, sunlight, water, soil pH and height, each switching the main chart, the page's colour and the calculations to that measure. A diagnostics list shows the latest unusual readings, and a calculations panel works out growth rate or the minimum, maximum and average over a date range you choose, or the Pearson correlation between two measures, stated in plain words. The 30 days are generated when the page loads, with occasional spikes, drops and missing readings built in, and the charts are Recharts.
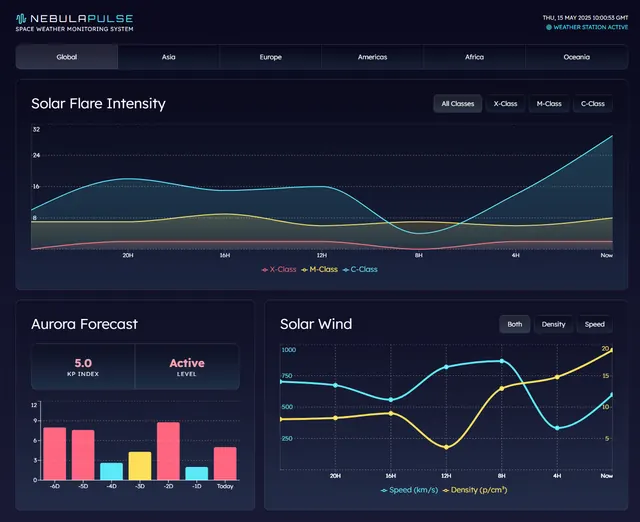
A futuristic space-weather dashboard that simulates monitoring solar flares, auroras and solar wind with real-time charts and a sci-fi interface.
A space-weather console in a sci-fi skin: solar-flare intensity by X, M and C class, an aurora forecast that reads the current Kp index on a scale from Quiet to Strong, and solar-wind speed and density on a two-axis chart, across six regions and under a live UTC clock. The history is generated when the page loads and the latest point is redrawn every five seconds, so the charts move without any data feed behind them. Charts are Recharts with gradient fills, set in Orbitron and Lexend.
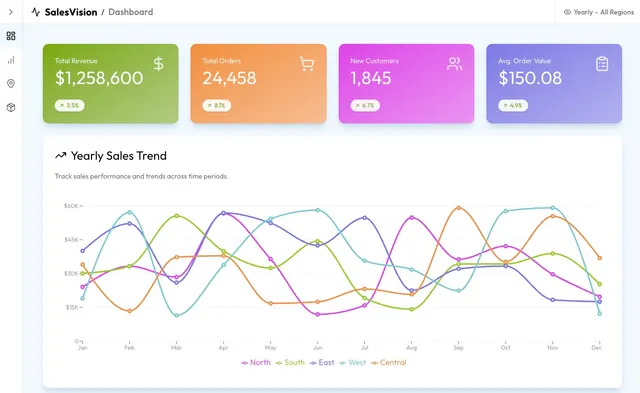
A sales analytics dashboard showing company performance by region, with time-period and region filters and clear, colourful charts for quick insight.
A sales dashboard, SalesVision, with four views (overview, sales, regions and products) behind a collapsible sidebar. A filter popover picks the time period, from daily to yearly, and any mix of five regions, and the charts redraw for the selection: trend lines per region, the last 30 days, grouped and stacked bars across ten product categories, and each region's share. The charts are Recharts, rendered only after mount to avoid server-render mismatches, and dark mode follows the system until you toggle it.
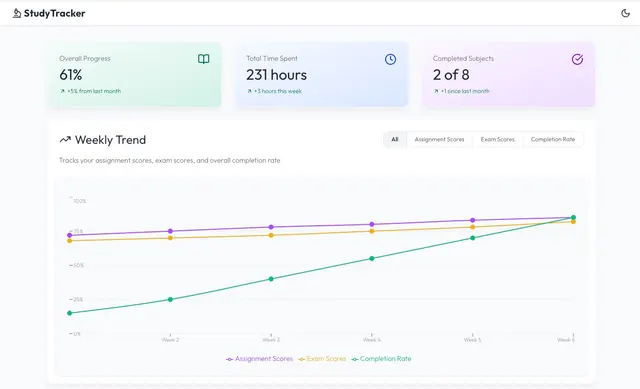
A study analytics dashboard that shows learning progress over time, with time spent and subject-by-subject insights to track patterns and improvement.
A study tracker across eight subjects: overall progress, hours and completed subjects up top, a six-week trend for assignments, exams and completion, each subject's progress stacked by assignments, exams and projects, time spent per subject, and a details table with deadlines and status badges. Every panel has its own status filter (urgent, in progress, completed, untouched) that folds into a dropdown on mobile, and urgency is worked out against today's date. Built with Recharts and motion, in a light and dark theme that starts from the system setting.
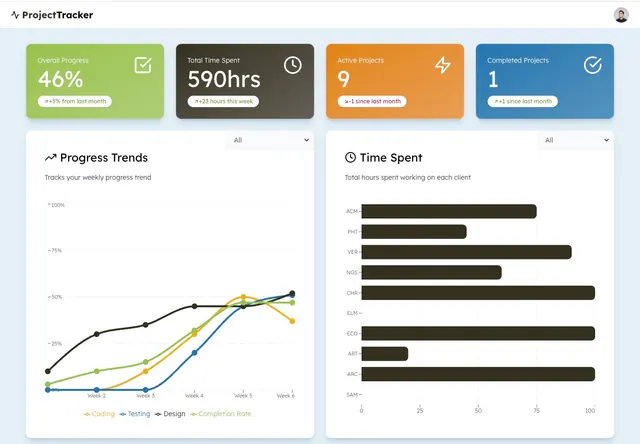
A project analytics dashboard for freelancers juggling several clients: tracks tasks, time spent and progress trends, with insights for each client.
A progress dashboard for a freelancer juggling ten clients: four stat cards, a progress trend filterable by coding, testing, design or completion rate, time spent per client, progress per client stacked by type of work, and a client table filtered by status that opens into a detail popup. Each client's progress is split across coding, testing and design in proportion to the hours spent on each, and the latest week on the trend is computed from the current clients' average. The charts are Recharts over a hardcoded set of clients.
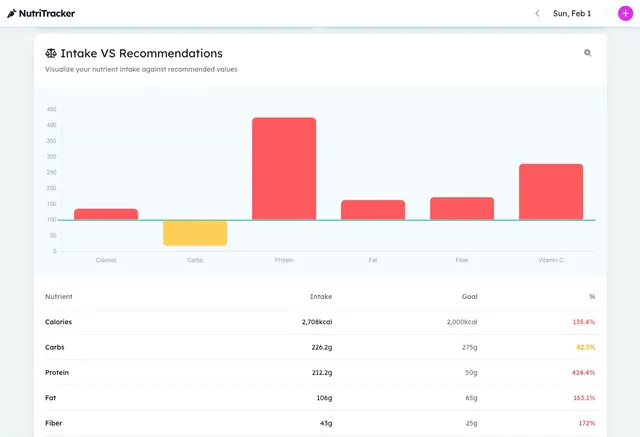
A day-by-day nutrition tracking dashboard: see each day's intake against recommended values, and log, edit or remove meals from a searchable food list.
A day-by-day nutrition tracker: step between days with the arrows or a swipe, see four macro cards showing how far each is over or under target, the macro split, when in the day each meal was eaten, and how every nutrient compares with its recommendation. Meals can be added from a searchable food list with a portion and a time, edited or deleted. The charts are Chart.js on canvas, with wheel, pinch and pan zoom from its zoom plugin, and the comparison draws its bars floating either side of a 100% line.
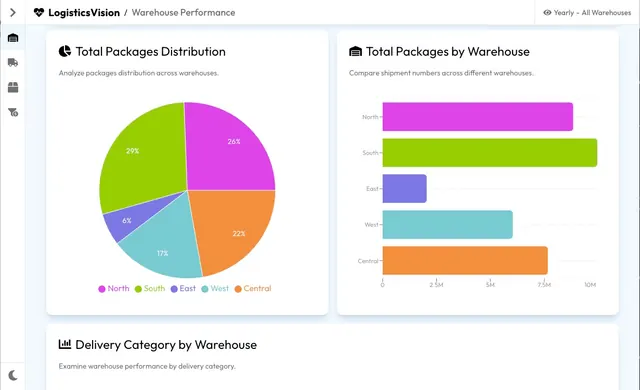
A logistics warehouse dashboard: shipment trends, delivery categories and each warehouse's share, filtered by period and by any mix of five warehouses.
A logistics dashboard for five warehouses: summary cards for delivered, in transit, new and average delivery time, a shipment trend per warehouse, each warehouse's share and total, and deliveries stacked across ten categories. A filter sets the period from daily to yearly, scaling the numbers to match, and any mix of warehouses, and the data regenerates with every change. The sidebar collapses to an icon rail, there is a dark mode, and every chart is Recharts, with the pie's labels placed by hand.
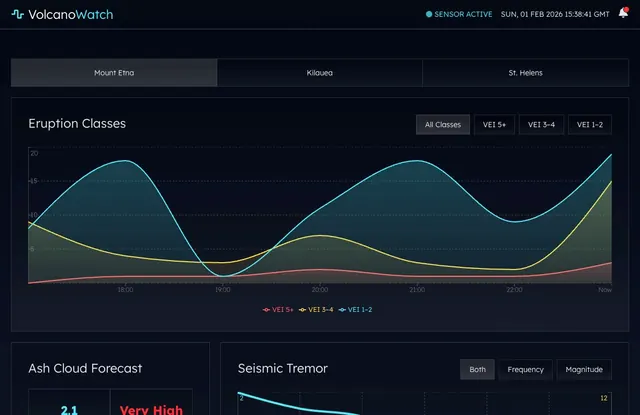
A real-time volcano monitoring dashboard that simulates seismic activity, with live charts of the data and an alert when an eruption is detected.
A monitoring dashboard for three volcanoes, Mount Etna, Kilauea and Mount St. Helens: eruption classes on an area chart filterable by VEI, a six-day ash-cloud forecast with a spread index and emission level, and seismic tremor frequency and magnitude on a two-axis chart. The history is generated on load and the latest reading is redrawn every five seconds, while a simulated alert reports an eruption every twenty seconds as a toast and in the notification panel. Glassy cards over Recharts, motion and sonner.
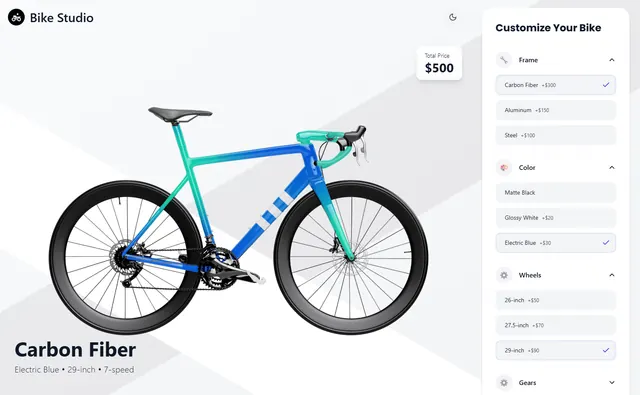
A bike product configurator: change the colour, wheel size and gears, add accessories, and watch the bike update in real time as you build your own.
A bike configurator: choose the frame material, colour, wheel size and gears, add accessories, and a live total with a price breakdown and a delivery estimate keeps up as you go. The preview is a stack of transparent PNG layers, so recolouring the frame is a matter of laying a different frame image over the same bike. The total springs on every change, and the dark mode starts from the system setting.
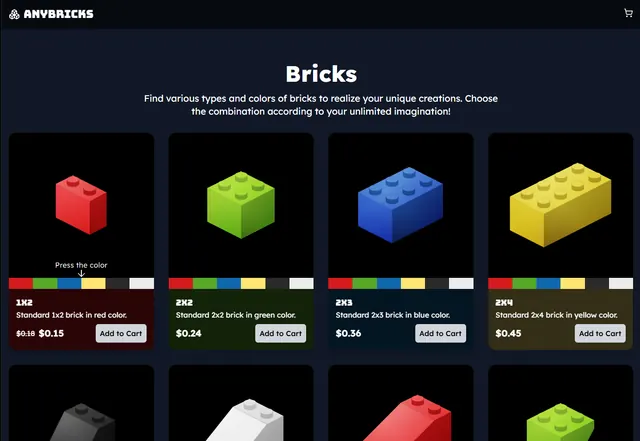
A LEGO brick product list where you recolour each brick right on its thumbnail, add it to the cart and change quantities without leaving the page.
A shop for LEGO-style bricks where every product is an inline SVG: picking one of six colours recolours the brick on its card by swapping the HSL shades of its top, front and side faces, and changes the price. The colour buttons double as quantity badges, a stepper sits on each card, and a cart dropdown keeps a line per colour with remove and a running total. Built with motion and react-hot-toast, with a dark mode that follows the system.
A feedback form with smooth animations and playful interactions: it works like any standard form, but makes sharing your thoughts more enjoyable.
A feedback form that tries to make leaving feedback feel good: five stars, each with its own caption from "Yikes, that was bad" to "Loved it!", a message box that asks for at least ten characters, and a thank-you view that plays back your rating and words. Clicking a star releases a copy of it that grows to four times its size and fades away. It is a single React component, with motion for the hover, tap and entrance animations and a dark mode that follows the system.
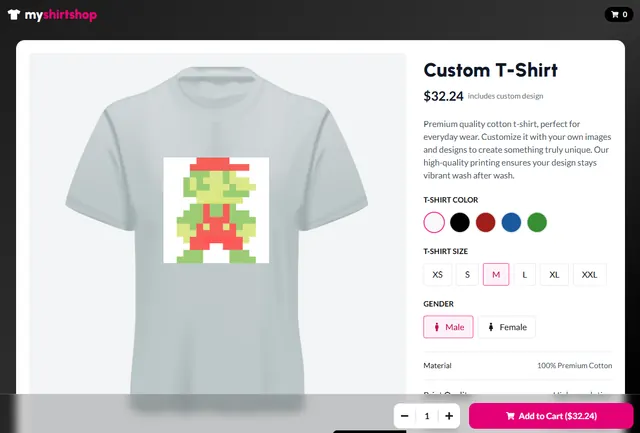
A custom T-shirt designer: upload an image, place it wherever you like, and watch the price update with the size of your print, right on the product page.
A T-shirt designer on the product page: pick one of five colours and a size, then upload a JPG, PNG or SVG, drag it around the print area and resize it from the corner. The price is the base shirt scaled by size plus a print cost that grows with the area the image covers, recalculated as you resize. The artwork sits over the shirt mockup at a position stored as fractions of the print area, so it stays in place at any screen size.
An e-commerce landing page for premium headphones with product highlights, customer reviews and an interactive form for writing your own review.
A product page for premium headphones: a crossfading image carousel with autoplay and thumbnails, a rating summary whose per-star bars are worked out from fourteen reviews, and a review form in a modal, checked field by field, whose submission goes to the top of the list with a Your Review badge. A fixed full-screen photo, with separate landscape and portrait crops, sits behind a blurred features section. Built with motion and react-hot-toast, with images from Unsplash.
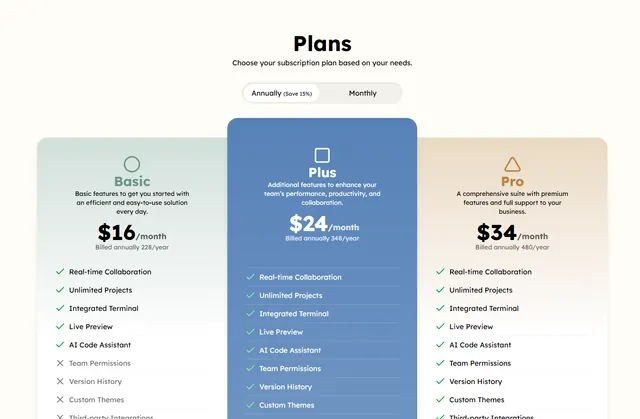
A modular pricing table for service businesses with clear package tiers, letting you customise a plan and see the price update in real time.
A pricing page with four plans: Basic, Plus, Pro and a Custom plan you build by toggling seven add-ons on top of five included features, priced as you go. Billing switches between monthly and annual at 15% off, prices animate as they change, and the subscribe buttons run a short mock checkout. The monthly and annual switch slides on a shared motion layout, and the light and dark theme starts from the system setting.
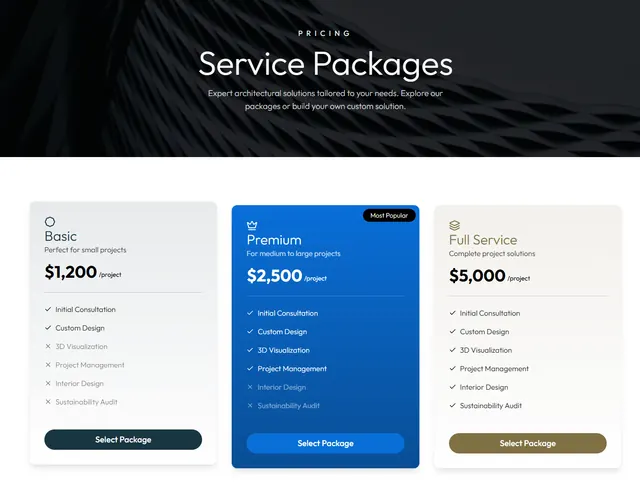
Pricing for an architecture firm: three per-project packages in distinct tiers, plus a custom package you build service by service with a live total.
Pricing for ArchiFive, an architecture firm: three fixed packages per project, Basic, Premium and Full Service, and a custom package built from six services, whose total appears once you pick the first one. The cards arrive on a staggered spring, there is a dark mode, and the buttons answer with toasts. Built with motion and react-hot-toast.
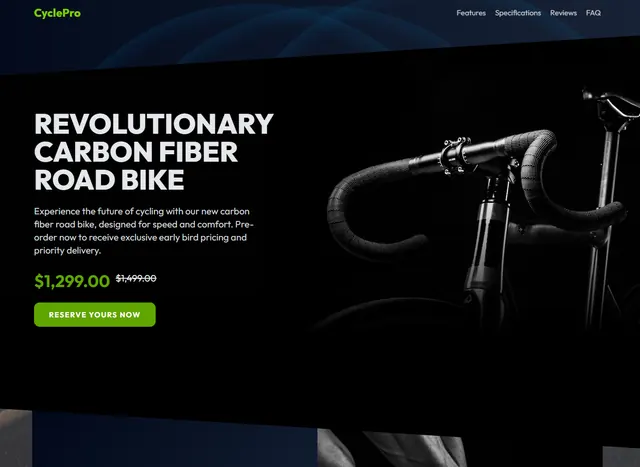
A bold, dark landing page for pre-ordering a premium road bike, mixing brutalist design with a sleek UI to sell exclusivity and high performance.
A launch page for a premium road bike, CyclePro, that borrows from brutalism: hard angles, heavy type and a dark palette. Section edges are clip-path polygons whose depth scales with the window, a fixed full-screen photo shows through the page as it scrolls, and each section slides in with motion whenever it enters view. It runs through features, specs, reviews and an FAQ built on native details elements, and ends in a validated pre-order form that confirms the reservation in place.
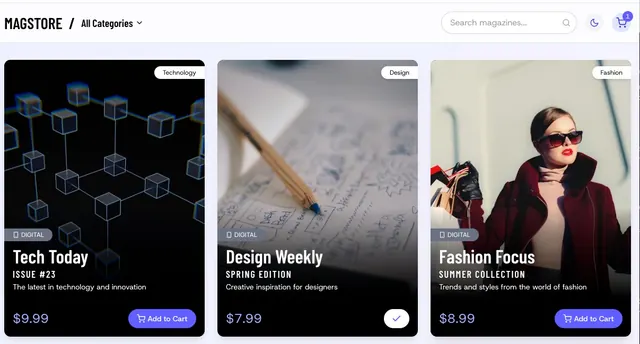
A product listing page for an online magazine shop, showing the covers in a sleek layout with a simulated, interactive add-to-cart flow.
An online magazine shop, MagStore: eight titles with Unsplash covers, a category filter and search across titles and descriptions, a detail view that opens as a modal on desktop and a bottom sheet on mobile, and a slide-over cart with quantities and a subtotal. Checkout is simulated and ends with a random order number. Built with motion, with a dark-mode toggle that starts from the system setting.
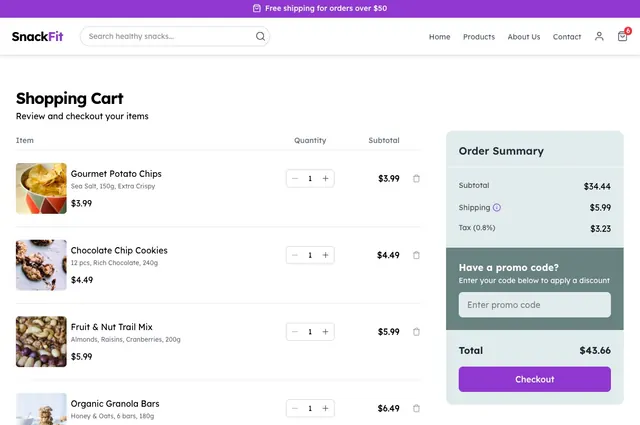
A clean shopping cart page with interactive quantity controls and a simulated coupon discount, designed for a smooth, simple checkout experience.
A shopping cart for a snack shop, SnackFit: change quantities, remove an item through a confirmation that slides up over it, and try a coupon code against a mock check. Shipping turns free above $50, tax is added, and checkout runs a short simulated payment that ends on a success screen. Items move into place with motion layout animations as the cart changes.
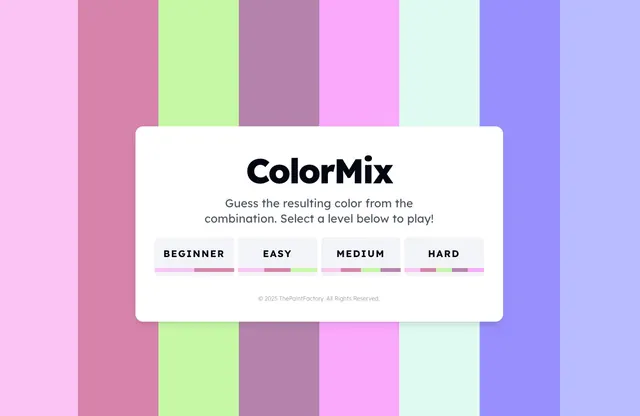
A colour-mixing game for anyone who loves colour: guess the final colour from a given combination, with adjustable difficulty and theme options.
A colour-mixing quiz in four levels, from two colours to five: see the strips, then pick their mix from five swatches. The answer is the average of the colours' red, green and blue values, and the palette can be pastel, vivid, dark or random, with the hex codes shown or hidden. A short tutorial opens the game, the header keeps count of right and wrong answers, and the chosen swatch grows into the result card on a shared motion layout.
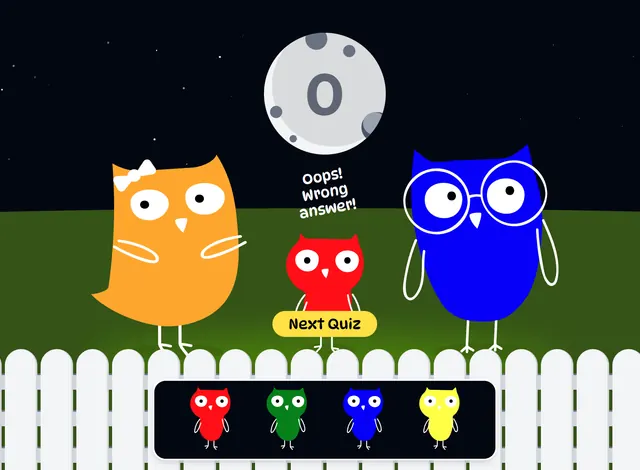
A colour-mixing quiz for children: two parent owls are paint colours, so guess their baby's colour. Twenty-five colours mixed by a real paint model.
A colour-mixing quiz with no table of answers anywhere in it. Paints are mixed by the geometric mean of their reflectances — the Beer-Lambert idea that pigments subtract light and so multiply rather than average, which is why yellow and blue come out green here and grey in anything that averages RGB. The palette is built by that same function: five pigments are given a hex, and the other twenty colours are declared as mixtures and coloured by whatever the mixer makes of them, so no swatch can disagree with the question. Which pairs the game may ask about is then discovered rather than written down — every pair is mixed, and the ones landing squarely on a named colour become askable, which turns up combinations nobody listed, like pink and sky blue making lavender or teal and rose making grey. Difficulty is measured, not assigned: a round scores high when its answer is easy to confuse with another paint, when it resembles one of its own parents, and when the parents are themselves mixtures. Rounds are drawn up that curve, and the three wrong owls slide from across the paint box to near misses as it steepens.
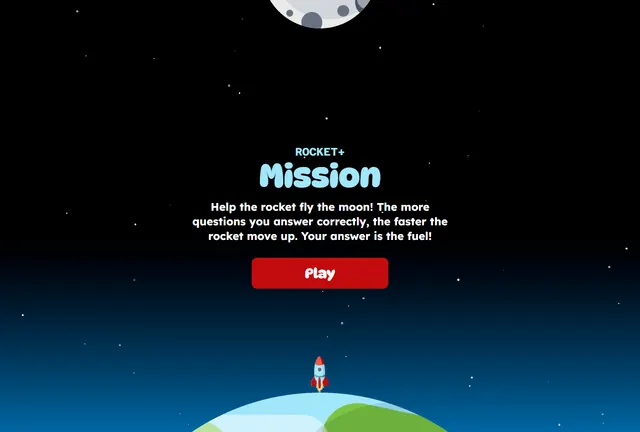
A maths game for kids: solve addition problems to fuel a rocket on its way to the moon, practising number skills in a playful space adventure.
An addition game for young learners: after a countdown, answer sums of two numbers from 1 to 10 by picking one of four options, and every right answer fuels a rocket climbing towards the moon. Correct answers add speed, wrong ones take it away and the rocket slowly loses speed on its own, so the race is against the clock; the end screen shows your time, flags a new record and lists every answer. The rocket is an inline SVG whose exhaust flickers faster as it speeds up, and a flame flies from Earth into the rocket on each correct answer.
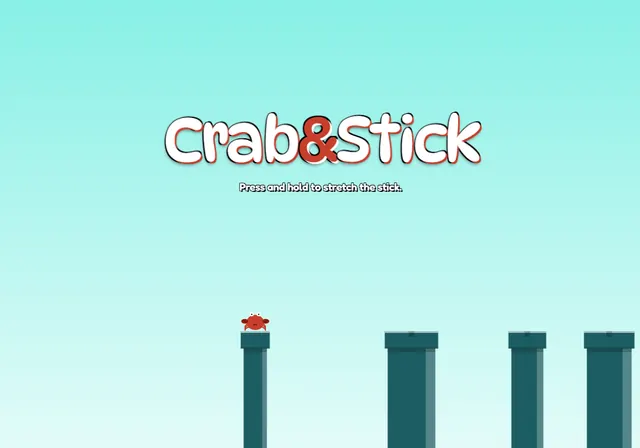
A Stick Hero-style game: grow the stick to just the right length to carry the crab across to the next pipe, and see how far you can get without falling.
A one-button game in the style of Stick Hero: hold the mouse, a finger or the space bar to grow a stick, let go to drop it across the gap, and the crab walks over if it reaches the next pipe. Landing in a pipe's small centre zone scores double, and the best score is kept in localStorage. Everything on screen, the crab, palm trees, waves and pipes, is drawn by hand on a 2D canvas every frame, with a slower-scrolling background for parallax, the crab's legs wiggling in alternating phase as it walks, and sharp rendering on high-density screens.
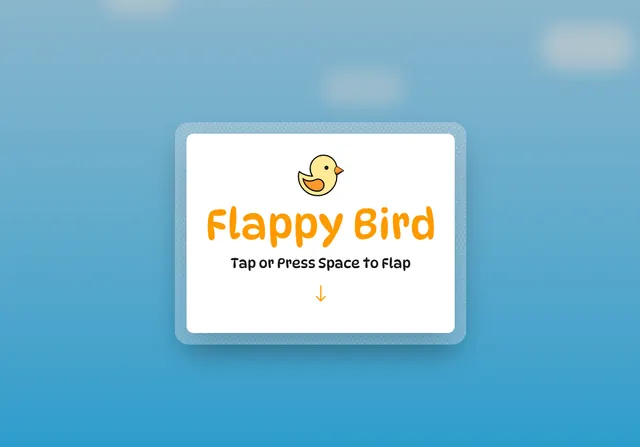
A Flappy Bird remake with my own design: tap to keep the bird in the air and fly between the pipes for as long as you can survive.
A Flappy Bird remake: tap, click or press space to flap through the pipes, one point per pipe, with the best score kept in localStorage. The look is its own: a hand-drawn SVG bird, DynaPuff type, checkerboard pipes and a scrolling ground, and clouds and a sun made of blurred divs. The bird is a DOM element moved by a requestAnimationFrame loop with simple gravity and a fixed flap impulse, tilting with its speed.
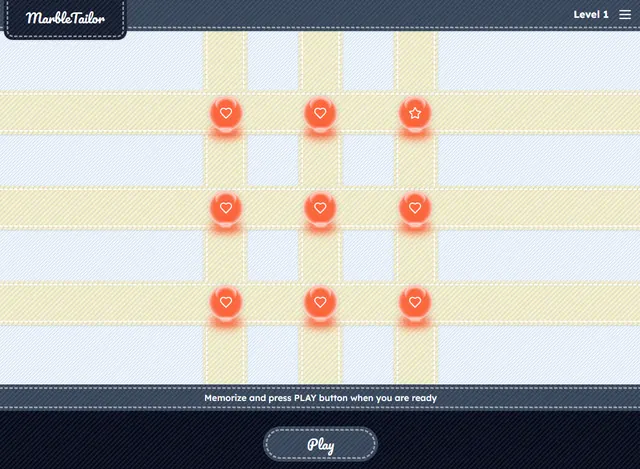
A memory puzzle game: memorise where the marbles sit, then put each one back in the right spot by its shape and colour. How good is your memory?
A memory puzzle on a 3×3 board: study nine marbles, each a colour and a symbol, press Play, then put them back from a shuffled tray. One wrong placement ends the round. Sixteen levels raise the difficulty by mixing in more shapes and colours, from two shapes in a single colour to nine of each, so later boards leave fewer repeats to lean on. Marbles travel between tray and board on shared layout animations, and their glossy highlights and the fabric texture behind them are pure CSS.
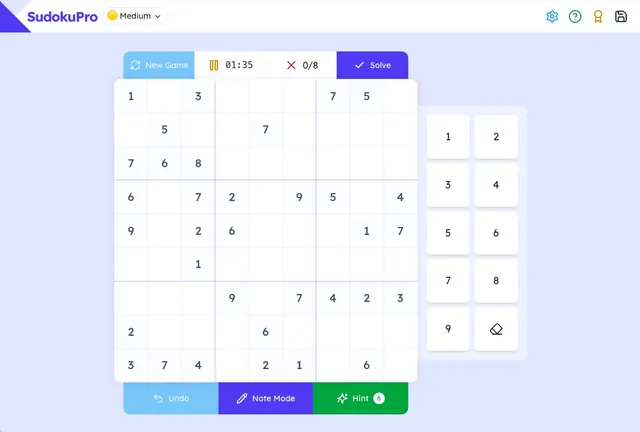
A modern Sudoku game to sharpen your mind, with a clean, sleek interface and a distinctive layout that sets it apart from traditional Sudoku apps.
A Sudoku game with four difficulties, from 40 cells removed on Easy to 65 on Expert, each with its own hint allowance and an optional error limit. Play with the keyboard (numbers, arrows, delete, and N for pencil notes) or the on-screen pad, with undo, a pausable timer, highlighting of matching numbers, save, load, export and import of a game, and stats kept in localStorage. Puzzles are generated by a randomised backtracking solver that fills a grid and then clears cells.
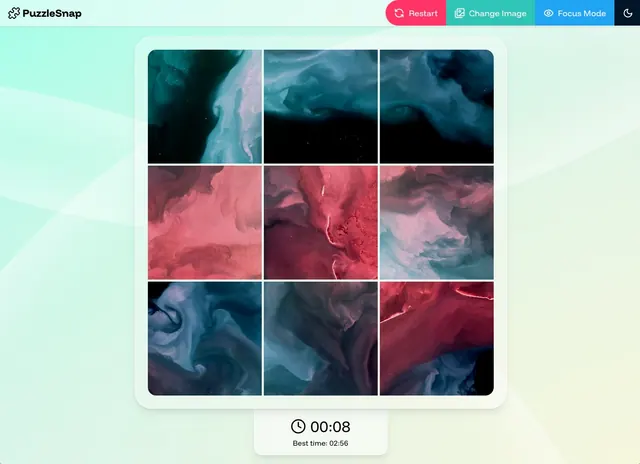
A tile puzzle with twelve preset photos: swap and rotate the shuffled square tiles until the picture is whole again, racing your own clock.
A tile puzzle, PuzzleSnap: choose one of twelve photos, which a hidden canvas cuts into nine square tiles, shuffled and turned at random. Drag a tile onto another to swap them and click one to turn it a quarter, until every tile is back in place and upright, against a timer. Dragging is dnd-kit with separate mouse and touch sensors, and there is a focus mode, a dark mode and confetti at the end.
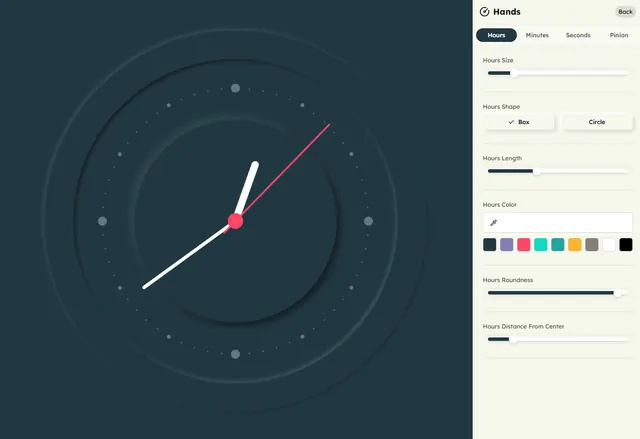
Build your own analog clock with smooth real-time hands. Customise the face, hands, markings and numbers, and save your designs as themes in local storage.
An analog clock you design yourself. Eight preset themes, from Station to Planets, are the starting point; the Customize panel then opens up the face, hands, markings and numbers one part at a time: width, length, colour, shape, roundness, distance from the centre and shadows, with six Google fonts for the numerals. The hands can tick or sweep, the clock can follow any of 35 timezones, and saved themes persist in localStorage. It is plain DOM and CSS transforms, no canvas or SVG; in sweep mode the second hand keeps adding to its rotation past 360° so it never spins backwards at the top of the minute.
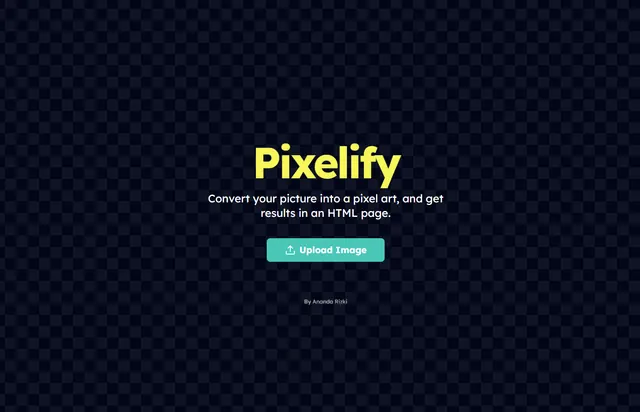
Turn any image into pixel art and download it as an HTML file you can host as a web page: a fun way to make and share retro-style pixel pictures.
Upload a picture and Pixelify resamples it onto a grid from 2×2 up to 128×128, reading one colour from the centre of each cell on a hidden canvas and previewing the result beside the original as you drag the slider. The output is plain HTML and CSS rather than an image: one class per colour and a div per pixel laid out in a CSS grid, ready to copy to the clipboard or download as a page you can host anywhere.
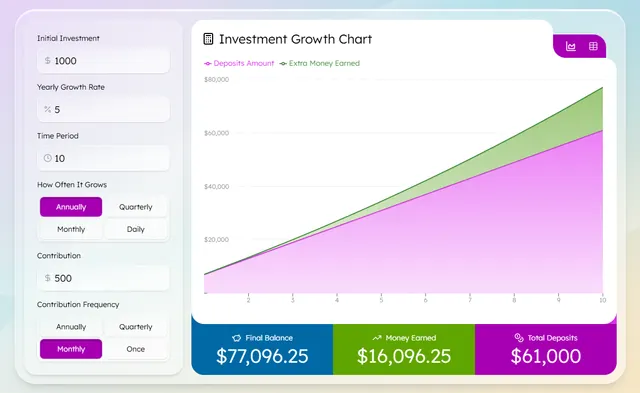
A compound interest calculator that shows how your investments grow over time. Adjust the numbers and watch your savings build year after year.
A compound interest calculator: set the starting amount, the yearly rate, the period, how often interest compounds (yearly, quarterly, monthly or daily) and a regular contribution with its own frequency, and the results update as you type. The balance is worked out period by period rather than from the closed formula, so contributions and compounding at different frequencies can be combined, and the growth shows as a stacked area of deposits against interest or as a table. Built with Recharts, with a light and dark theme.
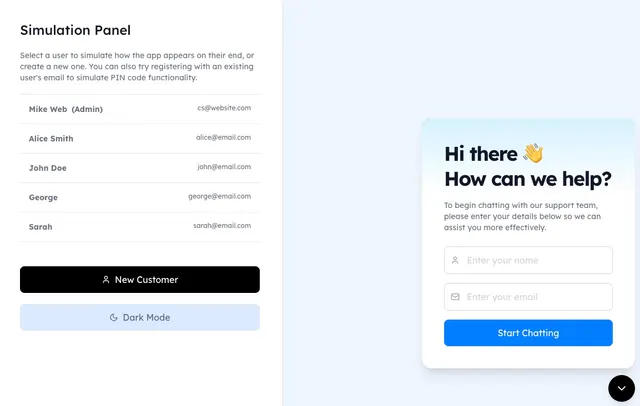
A support chat widget seen from both sides: switch between an admin and customers to try quoted replies, read ticks, unread badges and a sorted inbox.
A support chat widget seen from both sides: a simulation panel switches between the admin and four customers, or registers a new one, with a PIN check for an email that is already known. Conversations have quoted replies, read ticks, unread badges and messages grouped under Today, Yesterday or the date, and the admin works from an inbox sorted by the latest message. Both sides are typed by hand by switching users, and everything lives in memory. Built with motion, date-fns and react-hot-toast.
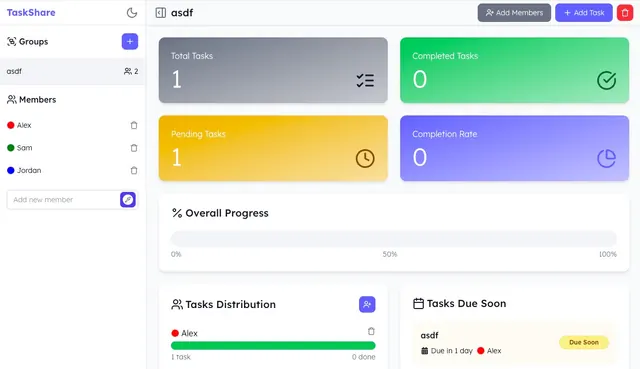
A team task management app with a dashboard that tracks how tasks are distributed across the team, their status and the overall completion rate.
A task manager for shared chores: create groups, add members and tasks with a frequency, then tick tasks off, reassign them, change due dates or rotate every task to the next member in one go. New tasks go to whoever has the fewest, and a removed member's tasks are handed on to someone else. A dashboard tracks totals, completion rate, how tasks are spread across members and the three due soonest. Built with motion and lucide-react.
Developer documentation for a fictional e-commerce API: product, order and auth endpoints with example requests, responses and a light/dark theme.
Developer documentation for MrShop, a fictional e-commerce API: eight endpoints across users, products, orders and authentication, each with its method and path, parameters, request body, colour-coded responses, use cases and tips, and copyable examples in curl, Python and JavaScript. A search popup lists matches in the current section apart from the rest, Prev and Next links walk the reference in order, and on mobile a swipe does the same. Built with motion, sonner and react-swipeable, with a dark mode.
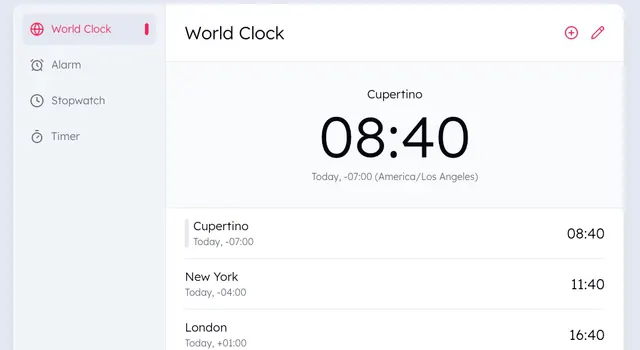
An iOS-inspired world clock interface that shows the time across cities, fully responsive with smooth light and dark theme support.
A world clock styled after iOS: a large clock for the selected city above a list of others, a searchable list of 51 cities to add from, and an edit mode to delete cities or drag them into a new order. Each city's time is worked out from UTC with its offset and ticks every second, and the list reorders on motion's Reorder. Light and dark themes start from the system setting.
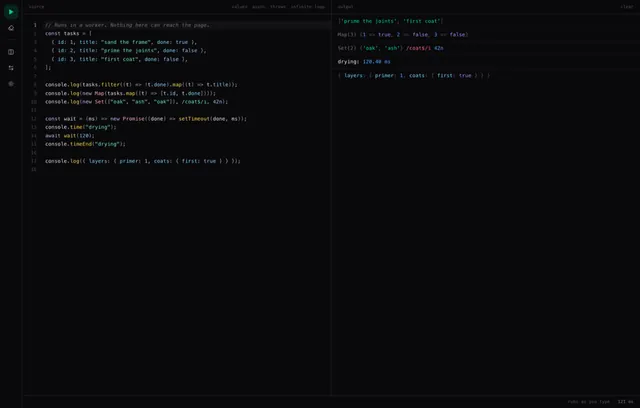
A JavaScript playground: write code in one pane and see its output in the other, with each run in a web worker that can be stopped at any time.
A two-pane JavaScript scratchpad: the source in one pane, whatever it printed in the other. The code runs in a Web Worker rather than on the page, which is what makes an unbounded loop survivable — a watchdog terminates the thread after two seconds, because terminating it is the only thing that stops a loop that never yields, and every run gets a fresh worker so nothing leaks from one into the next. Output is formatted rather than stringified: Maps, Sets, circular references, sparse arrays and getters each print as themselves, and error line numbers are mapped back to the editor's own numbering. The editor is CodeMirror, with completion scoped to what the sandbox actually exposes instead of the page's globals. Panes stack or sit side by side in either order, and the layout is remembered.
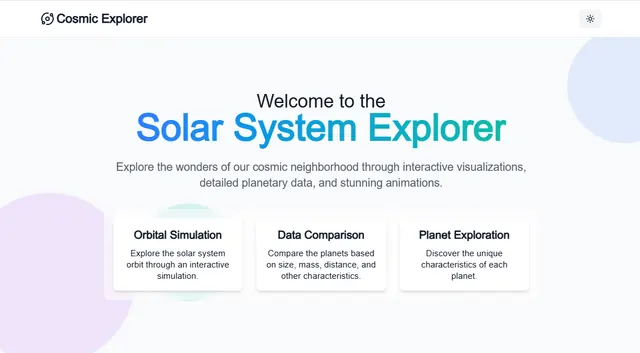
An interactive solar system landing page: explore planet facts, compare their stats side by side, and watch animated orbit simulations.
A one-page tour of the eight planets: an orbital simulation you can pause, reset and speed up from 0.1× to 5×, six comparison charts (size, mass, moons, distance, orbit and temperature) drawn with Recharts, and a card per planet that opens into a detail view. The orbits are pure CSS: each planet circles on a keyframe animation whose duration is its real orbital period divided by 1000, and the speed slider rescales every duration at once through calc(). Distances and sizes are schematic rather than to scale, so all eight fit on one screen, and the page follows the system's light or dark theme.
A clean landing page for painters to showcase their artwork and present their services to a wider audience, from past work to what they offer.
A one-page site for a painter, Elena Frost: a hero that slowly zooms as you scroll, a masonry gallery filterable by abstract, landscape and portrait with an enlarged view, the artist's story, services, a timeline of the artist's journey, rotating testimonials and a contact form. Built with motion, in Montserrat and Playfair, with imagery from Unsplash.
A bold landing page for tattoo artists to showcase their work and present their services, with a strong visual style built around the craft.
A one-page site for a tattoo artist, Mike Dash: a portfolio of nine pieces filterable by black, colour and minimal, with a lightbox, then about, services with stats, testimonials and a contact form that simulates sending. A fixed full-screen background shows through semi-transparent sections, which slide in each time they scroll into view, and the display type is Pirata One. Built with motion and lucide-react.
A sleek, elegant landing page for professional furniture makers, clearly structured to show their craft and services and win new customers.
A one-page site for a furniture maker, Simone Louis: a hero over a fixed full-screen photo, a portfolio of nine pieces that open into an enlarged view, an about section with stats, services, testimonials and a contact form that simulates sending. Sections slide in each time they scroll into view, the mobile menu is a full-screen blurred overlay, and the photography comes from Unsplash. Built with motion.
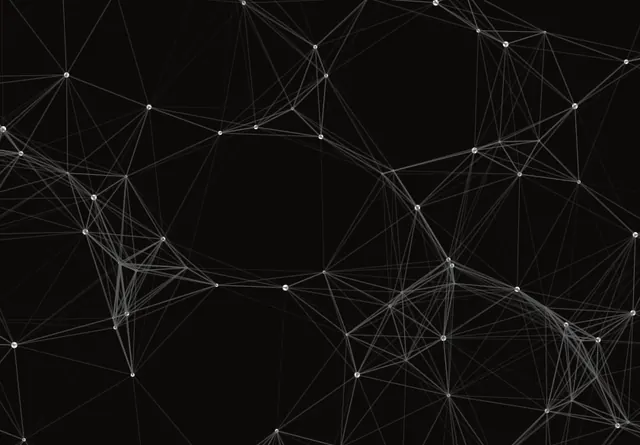
An animated background of connected particles, fully customisable: tweak the count, speed, size, connection distance and colours to suit any interface.
An animated background of particles drifting and bouncing off the edges, with a line between every pair closer than the connection distance, fading as they move apart. A settings drawer sets the count, connection distance, speed and size, and the particle, line and background colours from pickers or presets, while the header text switches between black and white to stay readable on the chosen background. Drawn on a 2D canvas in a requestAnimationFrame loop, with motion for the drawer.
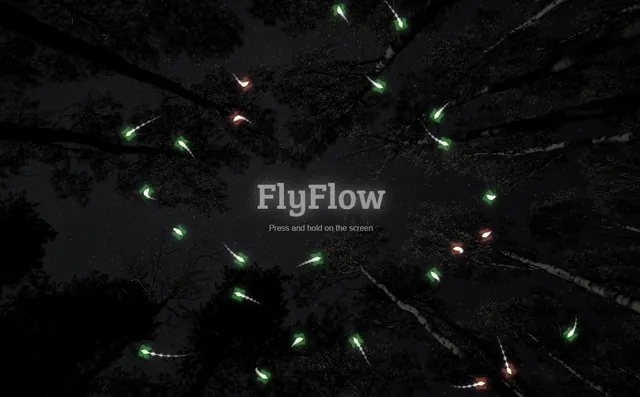
A swarm of thirty fireflies on a canvas: press and hold and they circle your pointer, each one fluttering on its own and trailing a glowing tail.
A swarm of thirty fireflies drawn on a canvas: each wanders on random acceleration with damping, pushes away from the others when they get too close, and trails a seven-segment tail that eases after its head. Press and hold and the swarm turns to circle your pointer, the title fades and the colours shift. Wings flap on a sine wave and the light adds up where flies overlap, drawn in a requestAnimationFrame loop at full screen resolution.
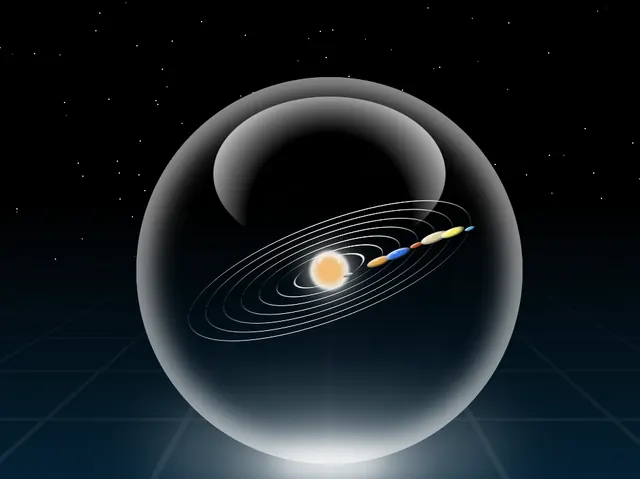
A CSS art experiment: a whole solar system floating inside a bubble, with planets orbiting a pulsing sun, drawn in pure HTML and CSS with no images.
A solar system in a tilted bubble, built with nothing but HTML and CSS: no images, no SVG, no canvas. Seven planets circle on a rotate3d keyframe, each with its own period, on an orbit plane tilted in 3D, and their sizes are scaled from real diameters. The sun is drawn as two halves, the top one stacked above the orbit plane, so planets pass both behind and in front of it, over a perspective floor of 900 grid cells and a field of stars.
A social polling app where results stay hidden until you vote. Browse polls by category, sort them by votes or likes, and create your own.
A social polling app where results stay hidden until you vote: then the bars animate in as they scroll into view, the winning option lights up and the percentages follow. Browse by category, search, sort by newest, most voted or most liked, and filter to polls you voted on, created, liked or still need to answer; you can like polls and create your own with two to five options. Built with motion and lucide-react.
A gamified Q&A app: spend coins to ask questions and earn coins by answering other people's, so being helpful keeps the conversation going.
A Q&A game with a coin economy: you start with ten coins, asking a question costs one, every answer you give earns one, and an answer chosen as the best earns its author ten. Browse questions with six filters, answer in forty characters or fewer, pick a winning answer on your own questions, and check the rankings and profiles. Cards open into a question on a shared motion layout, and a coin flies into the header whenever your balance goes up.
A social app for everyday dilemmas: post a question, get yes/no votes from the community, and read the reason behind each vote before you decide.
A place to ask for advice on everyday dilemmas: post a question with a topic, and others answer yes or no with a reason. Results stay hidden until you have taken part, then the yes/no bar animates from an even split to the real one, and the person who asked records their final decision, which closes the post. Search, filter, sort and browse by topic, and switch between ten demo accounts to see each side. Built with motion and react-hot-toast.
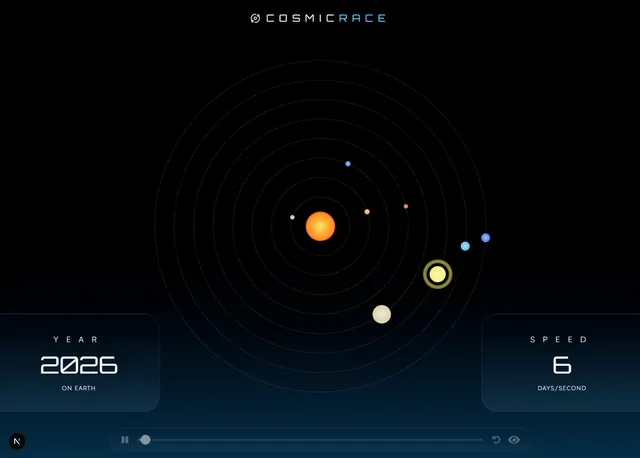
A solar system simulator built on real orbital data: move planets to different orbits and watch how fast each one races around the sun at its real speed.
The solar system as a race track. Each planet circles the sun at its real average orbital speed in km/h, along an orbit whose real length in kilometres sets how long a lap takes, all drawn in a single SVG. Move a planet onto another planet's orbit and it keeps its own speed, so Mercury on Neptune's track laps far faster than Neptune does, while a year counter ticks over with Earth. Fading trails, orbit and planet labels, and a size-ratio view can be switched on from the menu.
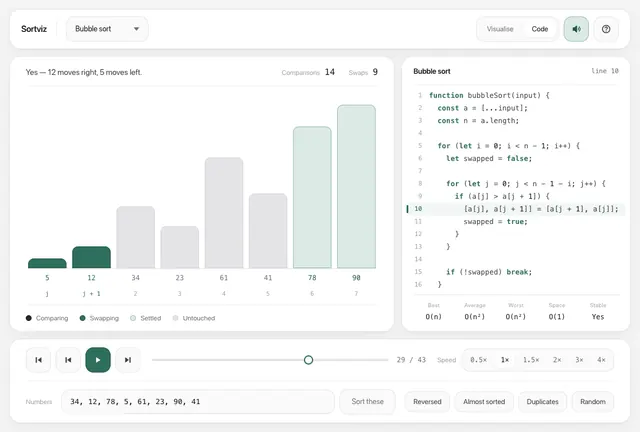
A sorting algorithm visualizer: step through bubble, selection, insertion, merge, quick and heap sort one comparison at a time, with code and sound.
Sorting algorithms stepped one comparison at a time, with the array, the code pointer, the counters and the sound all rendering the same frame index — the run is traced before anything is drawn, so the pointer cannot drift from the animation and stepping backwards costs exactly what stepping forwards costs. The sound is a Web Audio instrument in about eighty lines, no dependency and no audio files: pitch is the value, mapped exponentially from F3 across 2.2 octaves, so an out-of-order pair falls and a settled one rises.
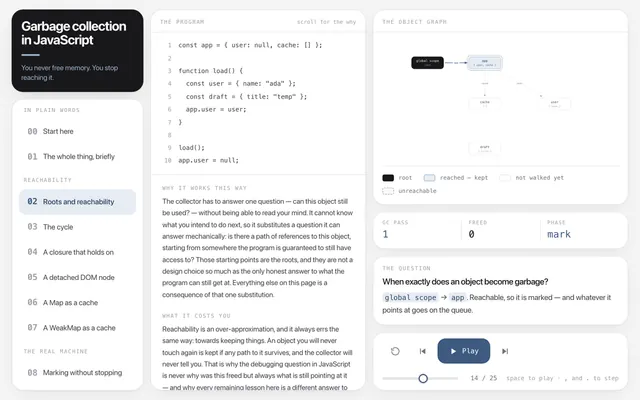
An interactive tutorial on JavaScript garbage collection: watch a mark-and-sweep collector walk real object graphs, then find a leak with Chrome DevTools.
A first-principles tutorial on garbage collection in JavaScript. It opens by explaining what memory is, what a reference is, and the three designs anyone has made work — manual free, reference counting, and tracing from roots — so that "reachability, not reference counting" means something before it is asserted. Then seven short programs, each with its object graph drawn out and walked by a real mark-and-sweep collector: a reference cycle that is collected anyway, a closure quietly holding a million-element array, a detached DOM node kept alive by a cache, a Map and a WeakMap that differ by one word, and tri-colour marking interrupted mid-walk to show why the write barrier exists. Every lesson also says why the collector is built that way, what the rule costs you in real code, and how to check the claim yourself. An eighth view drops references entirely and shows the same collector as memory — a nursery, an old generation, promotion after two survivals. A ninth is the part most tutorials skip: how to find a leak in your own application with a heap snapshot, a retainer chain and the three-snapshot technique. A tenth lists the sources: the ECMAScript specification's liveness clause, V8's own posts, Ungar's 1984 paper, and the Node commands that produced the numbers, with their real output. The point is that a leak in JavaScript almost always means "still reachable by accident", and that reachability is a substitute for a question no collector can answer.
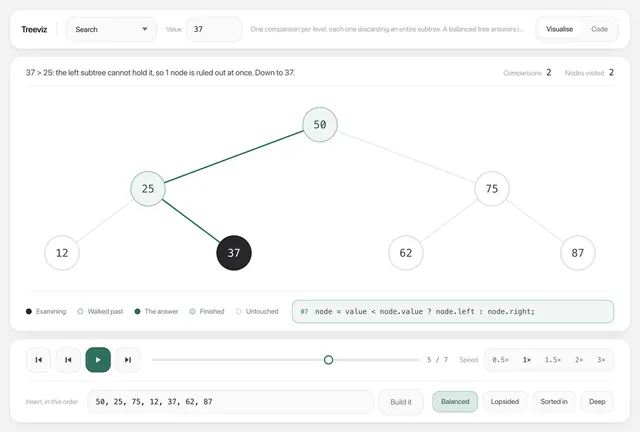
A binary search tree visualizer: search, insert, delete, traversals and classic interview questions like height, balance and LCA, one step at a time.
Sixteen operations on a binary search tree, stepped one comparison at a time: search, insert, delete with its awkward two-child case, invert, the four traversals, and eight questions asked about a tree rather than done to one — height, balanced, longest path, mirror image, valid search tree, path sum, kth smallest, lowest common ancestor. Those last eight are grouped together because they are one idea underneath: a fold from the leaves upward, where a node cannot answer until both children have, and the badge under each node is that node's returned value. A frame is a whole snapshot of the tree rather than a diff, and node ids are stable across frames, so the diagram animates instead of blinking when an operation replaces the root.
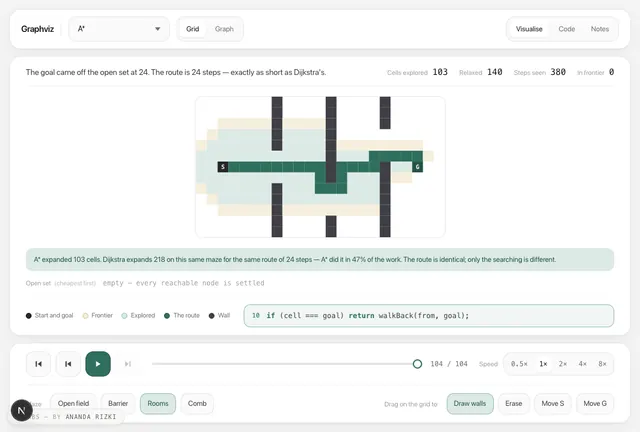
A graph algorithm visualizer: BFS, DFS, Dijkstra, A*, Bellman–Ford, Kruskal, Prim and more, stepped one edge at a time on diagrams and a paintable grid.
Ten graph algorithms across three drawings, because a graph algorithm's lesson lives in a different picture depending on what it does: a node-link diagram for the traversals and the spanning trees, a paintable grid for pathfinding, and a parent-pointer forest for union–find, which is a picture of bookkeeping rather than of any graph. Node positions are authored by hand rather than produced by a force simulation, so every frame draws identical points and stepping backwards lands on a pixel-identical picture. The grid is where A* earns its keep and where it does not: it explores 103 cells against Dijkstra's 218 on the rooms maze for the same 24-step route, and 201 against 227 on a comb maze where the route doubles back and the heuristic is simply wrong. Kruskal draws the union–find forest underneath the graph, so accepting an edge and merging two trees read as one event, and it builds the same tree Prim does in a completely different order.
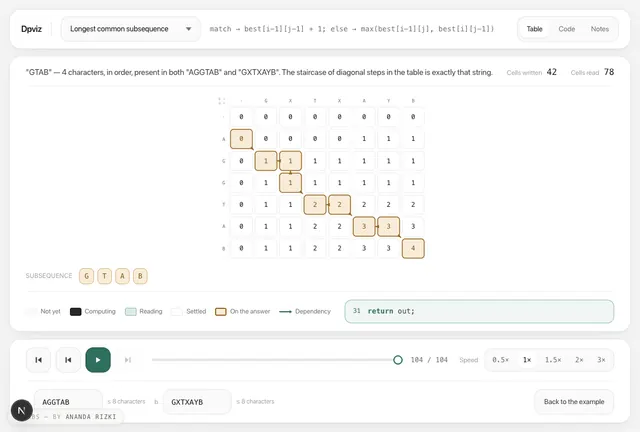
A dynamic programming visualizer: watch the table fill cell by cell with arrows to its sources, then trace back the answer, from Fibonacci to matrix chain.
Thirteen runs over eight problems, ordered as a curriculum rather than by difficulty: Fibonacci first, as four runs on one problem — naive recursion tree, memoised, bottom-up table, two variables — because the argument for the whole technique is watching the same tree get pruned. Then grid paths, coin change, knapsack, longest common subsequence, edit distance, longest increasing subsequence and matrix chain. Three things a printed table cannot do carry the app: arrows drawn from the cells each new cell was read from, a traceback phase that walks backwards and reconstructs the actual answer rather than just its number, and a deliberate wrong run — the knapsack rolling array iterated upwards — where per-cell item stamps make the double-count visible instead of merely described. Every traceback was checked against an independently computed answer: the edit script is replayed and has to turn one word into the other, and the matrix-chain bracketing is re-priced by multiplying it out.
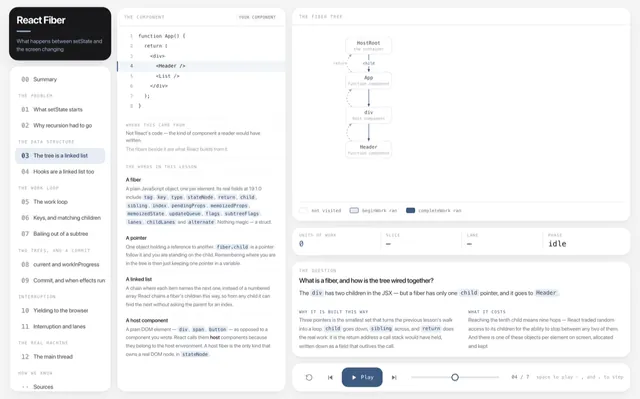
An interactive tutorial on how React Fiber works, read from React 19's own source: the work loop, the fiber tree, keys, commit and concurrent rendering.
Eleven lessons, each a small component tree with React's work loop walked across it one fiber per frame: beginWork down, completeWork back up, with the code panel showing React's own source and saying, on every lesson, whether what you are reading is verbatim or simplified. It starts before the jargon does — what setState really does (it writes a lane and walks to the root, it does not render), and why the pre-Fiber recursive render could not be paused, because the position in a recursive walk is the JavaScript call stack and a call stack cannot be saved in a variable. From there: the fiber tree as a linked structure, hooks as a second linked list and why that is the real reason for the rules of hooks, the work loop, how keys decide which fiber is which, bailouts, the two trees and the pointer swap, where useLayoutEffect and useEffect actually run, and what happens to half-finished work when something urgent arrives. Every lesson also says why React is built that way and what the choice costs. The fibers are laid out the way the pointers point: child drops down, sibling goes right, return comes back up the left gutter, so reading the diagram is reading the data structure. A twelfth view is a captured profile rather than a drawing — the same 120-component update rendered plainly and inside startTransition, measured at 83.1 ms in one block against 5.5 ms in sixteen, for the same total work — and a Sources view lists every claim with the React file, the function and the constant it came from. Written for someone who has never opened React's source, and built so they do not have to take any of it on trust.
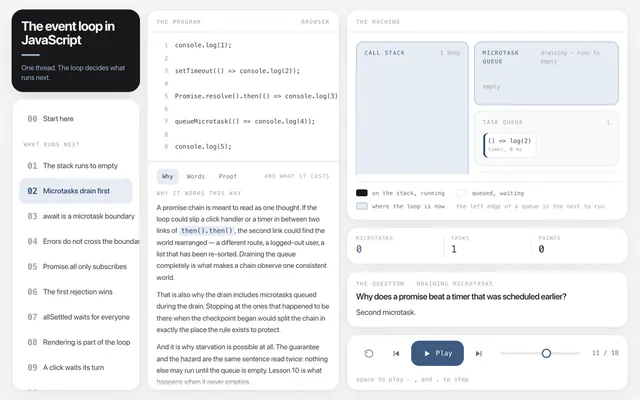
An interactive tutorial on the JavaScript event loop, from first principles: fourteen short programs traced through the call stack, microtasks and tasks.
An interactive tutorial on the JavaScript event loop, built so a beginner finishes understanding the why as well as the what. It starts from symptoms anyone has seen — a dead button, a spinner that stops spinning, text arriving in bursts — then explains why the platform has one thread at all and what a callback "arriving later" physically is. Fourteen short programs are then traced through the loop's own parts: a call stack, the microtask queue, the task queues, the animation-frame callbacks and the rendering steps, with the panel the loop is currently inside taking the accent border. They cover the stack running to empty, microtasks draining before any task, await as a microtask boundary desugared to .then, why try/catch cannot reach a later task and when an unhandled rejection is reported, what the promise combinators actually cost the loop — Promise.all as a subscription that starts nothing and answers two microtask turns after its inputs settle, the first rejection winning while the other work carries on uncancelled and unreported, and Promise.allSettled waiting for every outcome and never rejecting — rendering as work the browser queues for itself at a rendering opportunity, why a click waits behind a long task and how that becomes INP, microtask starvation, the 4 ms timer clamp, the fact that the spec says a task queue rather than the task queue, how to hand the loop back with scheduler.yield, and how Node differs. Two machine views measure the same loop against a 16.7 ms display frame and walk Node's libuv phases in the order they run since Node 20. Every lesson carries a Why panel, an in-place glossary and a Proof panel: the exact specification sentence — including the ECMAScript algorithms for PerformPromiseAll and PerformPromiseAllSettled that the tick counts are derived from — or the snippet that was run and the output it printed, in Chrome 152 and Node 24.
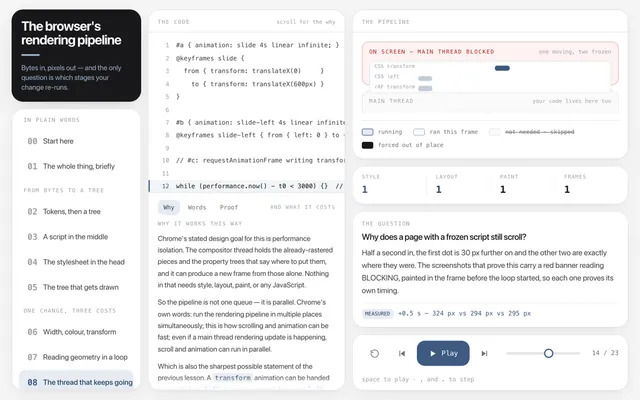
An interactive tutorial on the browser rendering pipeline, from bytes to pixels: parsing, style, layout, paint and compositing, measured in real Chrome.
A first-principles tutorial on the browser's rendering pipeline. It opens by explaining what a browser is actually being asked to do — you hand it a string of bytes and it has to produce a rectangle of coloured pixels, sixty times a second — and works through the machine that does it: tokenizing HTML into a stream of tokens, building a DOM tree from them, parsing CSS into the CSSOM, combining the two into the tree that actually gets drawn, laying that tree out into boxes with real coordinates, painting those boxes into lists of drawing commands, and handing the result to a compositor that can move it around without asking the main thread. Then the question the whole subject turns on: when you change something, which of those stages has to run again? Nine lessons, each a short document or a short loop, traced frame by frame. A classic script in the middle of the body blocks the tokenizer while a deferred one does not; a stylesheet in the head does not block parsing but does block first paint, measured at 448 ms against a 12 ms control; a node with display:none is absent from the render tree while visibility:hidden is present and costs the same layout; a width change re-runs style, layout and paint, a background-color change re-runs style and paint but not layout, and a transform re-runs neither — 59 Layout events against 0 against 1, counted in a real Chrome trace; a loop that reads offsetWidth between writes runs 1,000 layouts and 224.5 ms where the batched version runs two and 0.8 ms; and a CSS transform animation keeps moving at 60 fps through a three-second main-thread block while the same motion written as `left` freezes solid. Every lesson also says why the pipeline is built that way, what the rule costs you in code you will actually write, defines every word it leans on where it uses it, and cites the specification clause or the captured trace behind each claim. Where a claim is Chrome-specific it says which Chrome; where the specification does not define a term that everybody uses — 'reflow' and 'layout' are both engine jargon, not spec vocabulary — it says that too.
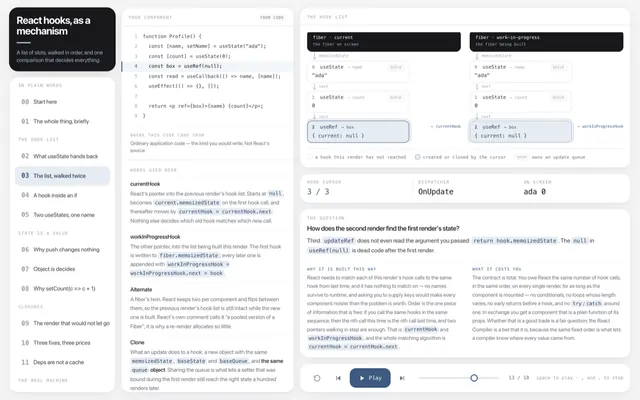
An interactive tutorial on how React hooks really work, read from React 19's source: the hook list, the rules of hooks, Object.is and stale closures.
An interactive tutorial on React hooks as a mechanism rather than an API, for someone who wants to know why the rules exist rather than what they are. It starts before the jargon: a component is a function, a function's variables die when it returns, a closure outlives the call that made it — and React therefore has to keep your state somewhere else and match this render's hook calls to the last render's state with nothing to match on but the order. Ten lessons then trace that machinery one frame at a time, with React 19.1.0's own functions named as they run: mountWorkInProgressHook building the linked list on fiber.memoizedState, updateWorkInProgressHook cloning it cell by cell while currentHook and workInProgressHook walk in lockstep, the dispatcher swapped into ReactSharedInternals.H before your function is called and swapped back the moment it returns. A hook inside an if is not asserted to be dangerous; the same walk runs, the cursor lands on the wrong cell, the variable quietly takes another hook's value, and React's real dev-mode table and its real thrown error are printed verbatim. Three lessons cover state as a value rather than a box — a pushed array that changes the data and nothing else, Object.is deciding a bail-out and disagreeing with === in both directions, and why setCount(c => c + 1) is a different computation rather than a different style. Three more are about closures: a stale one built step by step inside a custom hook, the three fixes and what each one costs, and why a dependency array is one slot rather than a cache. A twelfth view is a recording rather than a drawing — three copies of the same hook running 20 ms intervals on one component, and the arrays they really pushed. A thirteenth runs eleven fixtures through eslint-plugin-react-hooks and shows the one shape it cannot see. Every number on the page was captured from a real render in Chrome, and the last view lists every file, function and script behind it.
An interactive tutorial on web authentication for frontend developers: OAuth 2.0, PKCE and JWTs traced step by step, then localStorage vs HttpOnly cookies.
A first-principles tutorial on authentication as a frontend developer meets it. It opens by explaining why a web request has to carry anything at all — HTTP keeps no memory, a password cannot be sent on every request, so the browser carries a stand-in — and only then introduces the four parties OAuth 2.0 defines. Then ten traced conversations, each drawn as a sequence diagram with the actual request beside every step: what a token replaced and why the server stopped remembering you; the authorization code flow one message at a time, with every parameter named and glossed; what PKCE adds and the exact problem it solves, using RFC 7636's own published test vector recomputed locally; why the implicit flow was retired, and the difference between RFC 9700 saying SHOULD NOT and RFC 10017 saying MUST NOT; a real JWT taken apart to show that the payload is base64url rather than ciphertext, that editing a claim breaks the signature, and that signed is not secret; and how an ID token differs from an access token, a distinction most tutorials blur. The second half is the decision: the same cross-site scripting and the same cross-site request forgery run against localStorage and an HttpOnly cookie at the same time, side by side, with what survives each — and the honest conclusion, which is that HttpOnly converts token theft into session riding rather than granting immunity, and that neither choice touches the attack the current best current practice considers worst. Then refresh tokens and rotation, including where rotation's detection provably fails, and the backend-for-frontend pattern that RFC 10017 strongly recommends instead. It is defensive throughout: mechanisms and mitigations, never payloads. Nothing is asserted without a citation, every credential on screen is fabricated, and the cookie claims — what SameSite=Lax really stops, and the two-minute grace period the attribute-less default still grants a cross-site POST — were measured in headless Chrome rather than repeated.







Social media
FunPoll, opens in a new tab
A social polling app where results stay hidden until you vote. Browse polls by category, sort them by votes or likes, and create your own.
A social polling app where results stay hidden until you vote: then the bars animate in as they scroll into view, the winning option lights up and the percentages follow. Browse by category, search, sort by newest, most voted or most liked, and filter to polls you voted on, created, liked or still need to answer; you can like polls and create your own with two to five options. Built with motion and lucide-react.
Questio., opens in a new tab
A gamified Q&A app: spend coins to ask questions and earn coins by answering other people's, so being helpful keeps the conversation going.
A Q&A game with a coin economy: you start with ten coins, asking a question costs one, every answer you give earns one, and an answer chosen as the best earns its author ten. Browse questions with six filters, answer in forty characters or fewer, pick a winning answer on your own questions, and check the rankings and profiles. Cards open into a question on a shared motion layout, and a coin flies into the header whenever your balance goes up.
SuggestMe, opens in a new tab
A social app for everyday dilemmas: post a question, get yes/no votes from the community, and read the reason behind each vote before you decide.
A place to ask for advice on everyday dilemmas: post a question with a topic, and others answer yes or no with a reason. Results stay hidden until you have taken part, then the yes/no bar animates from an even split to the real one, and the person who asked records their final decision, which closes the post. Search, filter, sort and browse by topic, and switch between ten demo accounts to see each side. Built with motion and react-hot-toast.